Statisticians come in from the cold
Two weeks ago my paper, Descriptive Statistics of the Genome, was accepted to the Journal of Computational Biology. I think it was the best part of my thesis, so I’m excited to see it finally being published.
Lectures
Last week I gave my first talk/lecture at the monthly luncheon of the Chicago Chapter of the American Statistical Association. That was my first talk in a couple of years. Last night I gave almost the same talk at my alma mater. The title is the same as this blog post. The thesis is that the popularity of data science has led to the creation of tools that allow statisticians to dominate the data science world with minimal effort.
What is a data scientist?
Instead of pontificating on the frequently discussed topic, here is a panel of smart people. Instead of ruining the surprise, I’ll let you listen to this over your morning coffee.
https://www.youtube.com/watch?v=C1zMUjHOLr4
I closed this section by referencing Zoubin Ghahramani’s point that we need to be mindful of the whole pipeline of data and not just the statistics and machine learning. This pipeline includes what is commonly known in industry as data engineering and visualization or front-end web design. His point is that machine learning and statistics are just a small part of the data science pipeline. Like this:
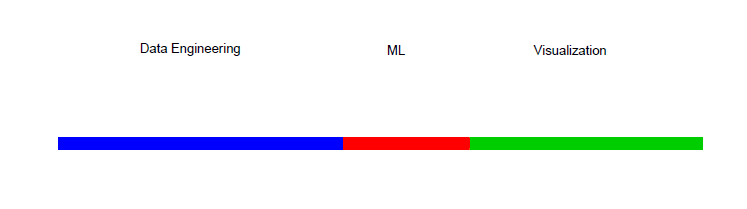
The point of my talk(s) was that with the modern tools developed by the popularity of data science, machine learning, and R the pipeline can look more like this:

All your data science are belong to us!
Required tools
BigQuery - a cloud-based SQL-like super-fast database system
bigrquery - an R package that allows you to pull data from BigQuery into the R environment
Shiny - “A web application framework for R. . . No HTML, CSS, or JavaScript knowledge required”
As an example I used data from a favorite website of mine, reddit.com
Because I’m busy, I was able to find a couple of people who had put all of reddit’s data into a public BigQuery dataset (fhoffa@reddit) and had created a couple of queries and ggplot graphs to display the data (Max Woolf). So my work was already 2/3rds of the way done! That’s efficiency. Thank you people! All I had left to do was turn it into a Shiny App. And that’s what I did. You type in a subreddit and/or reddit username and you’ll get a word cloud and the posting time of the most popular posts matching that description in seconds, as soon as you make like Captain Pickard and “Engage”:

https://troyhernandez.shinyapps.io/reddit/
The code is here. Apologies, it’s not the prettiest. You do have to get a free BigQuery account and put your account’s project id into the quotes that point to project in the server.R file (line 7).
Conclusion
I finally opened up a shiny.io account from Rstudio. That’s where that Shiny output above is coming from. It integrates nicely with Rstudio, github, and (hopefully, we’ll see when I hit publish) but not iframe-ing into this Wordpress site. (It looks like I’ll have to up my game to make that happen.)
So there you have it. 111GB (or 215m rows) of information processed in a matter of seconds and displayed to you using only R and web services. It appears as if all your data science are belong to us.