Crime in the 25th Ward
Crime has come up at a couple of the 25th Ward aldermanic forums. Typically, the dance that is done is: The moderator asks how we’re going to respond to crime in the community and everybody is supposed to say:
As alderman I will get more officers in our ward!
As a statistician, I’m forced to question the premise. I refer to an insight from a book that examines the media’s relationship with politics, Hate Inc. by Matt Taibbi:
Every crime reporter will tell you there are two major outlets for national crime statistics, particularly violent crime: the annual reports by the FBI, and the Bureau of Justice Statistics. Both are outputs of the Department of Justice, but the BJS uses the same methodology every year (it’s based upon broad surveys of households, asking people if they were victims of crimes) and tends to report less alarming statistics. Newspapers inevitably use FBI stats, which use varying methodologies and somehow always come out a little scarier. Going by the FBI, violent crime fell 49% between 1993 and 2017. By the BJS, violent crime fell 74% during the same period. But the public doesn’t believe it.
The BJS provides only national statistics and it’s an entirely fair question to ask what’s happened specifically in Chicago, or the 25th Ward, or in a particular neighborhood of the 25th Ward.
Naturally, as a data scientist, I went looking for data. And it exists! The Chicago Data Portal has a dashboard with crime data from 2001 until the present. The dashboard provided wasn’t very useful, so I just downloaded the data and analyzed it below using my usual tool, the open-source programming language R.
If you dig into the documentation you’ll find that this data is of the headline-grabbing FBI variety; i.e. FBI’s Uniform Crime Reporting Program. Despite having uniform in the name, the data isn’t uniformly collected. Flaws in crime statistics were explained to me 10 years ago by a chance encounter with a French criminologist.
This criminologist explained to me that if a police union is in negotiations with a politician, crime will go up. When their contract gets approved, crime will go down. That’s one example of why this data is not the most reliable. Politics, changes in enforcement or reporting, etc. can all move the needle.
That said, I’m no criminologist. I’m just trying to answer a few specific questions for my potential constituents. Is crime going up or down?
What follows is sure to be quoted, without attribution, by one of my desperate competitors trying to look like they have ideas and insights at the next and final forum. At this point you could make a drinking game out of the other candidates stealing my message. Regardless, the lessons continue…
Chicago
Let’s first look at the stats for all of the city. I’m going to go from most common crimes to least common.
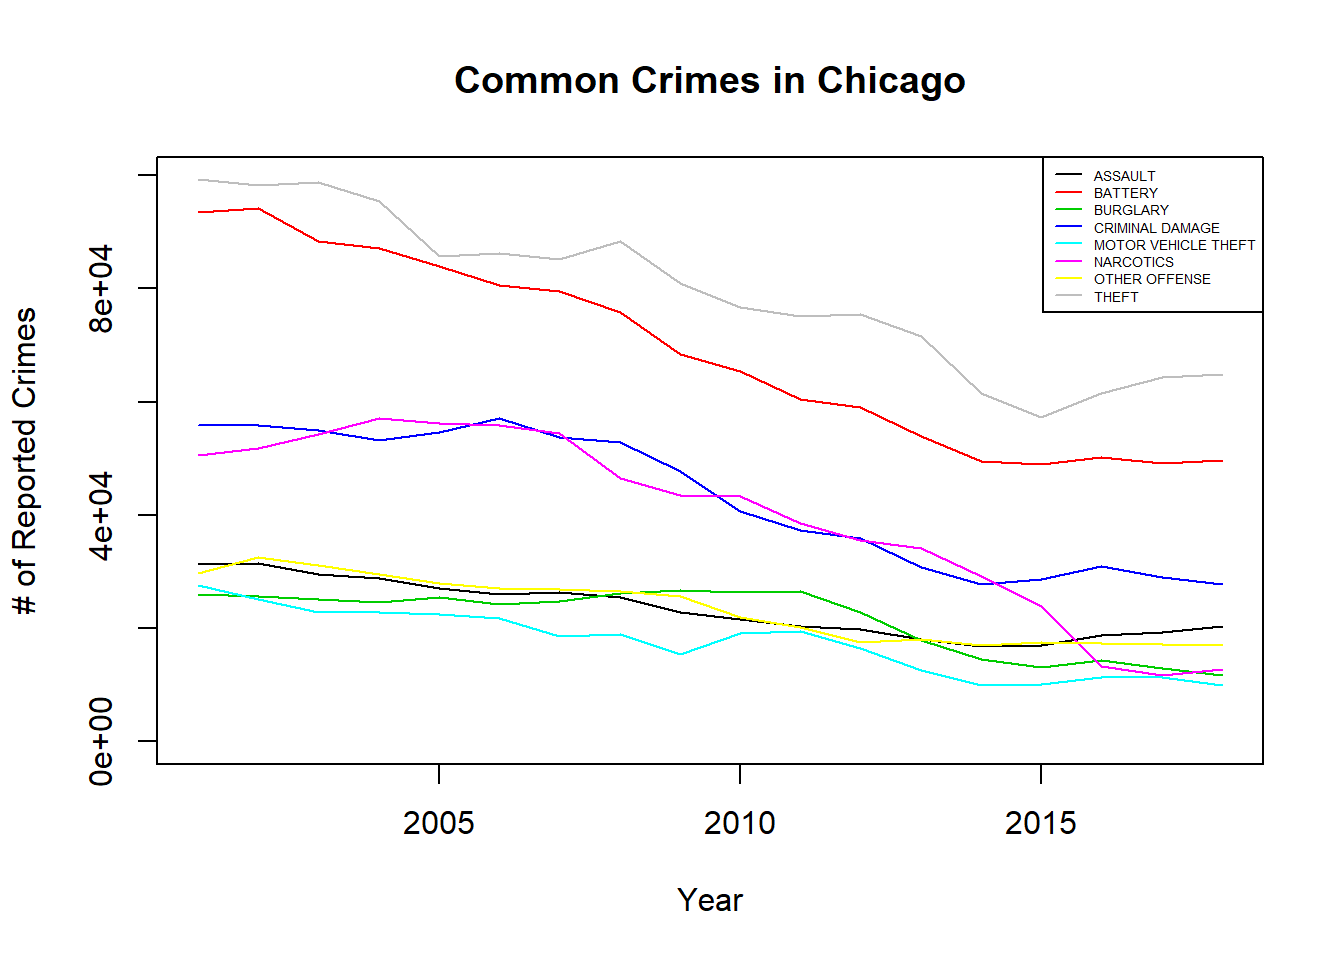
As you can see, despite the headlines, the most common crimes have been trending down city-wide for the last 18 years. Sure there was a little bump in 2016, but by and large things have flattened out and we’re back to living with crime stats that resemble 2014. For those not remembering their scientific notation, “4e+04” is 40,000 and “8e+04” is 80,000.

For these less common crimes, you see a similar pattern. A bump in 2016 and 2017 in robberies that went away in 2018. Everything else is trending down with the exception of deceptive practice and weapons violation. Weapons violations are possessing, carrying, using illegal weapons. Is this an artifact of increased enforcement or an influx of guns into the city? I don’t know. I had to look up deceptive practice. It’s bad checks, stolen credit cards, etc. That’s an economy related issue. Just a reminder that the booming economy is not booming for everybody.
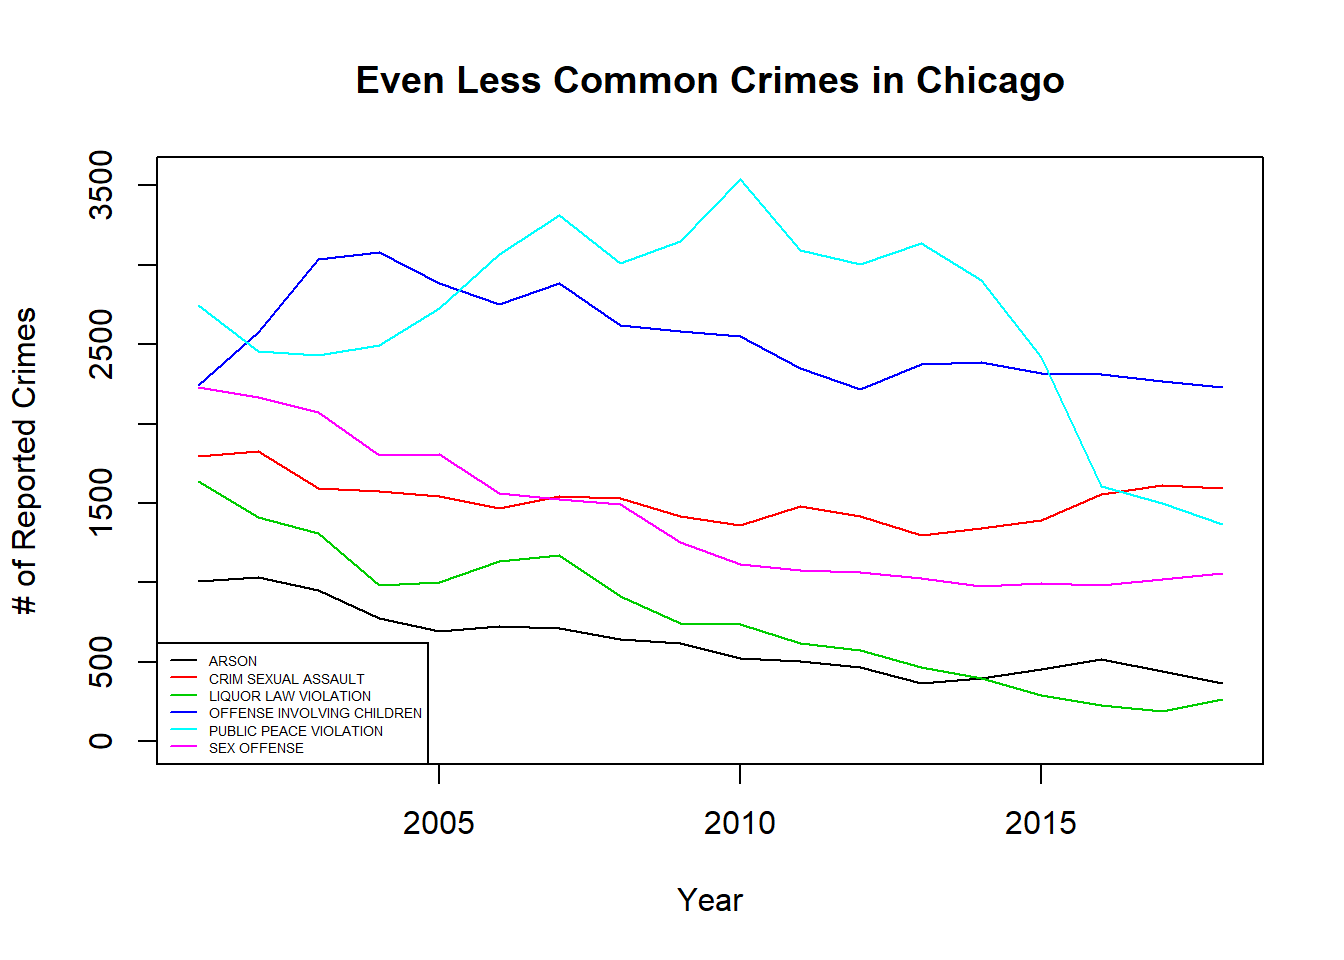
Again, same pattern. The dip in public peace violations seems curiously strong. I’m guessing that’s a change in enforcement.
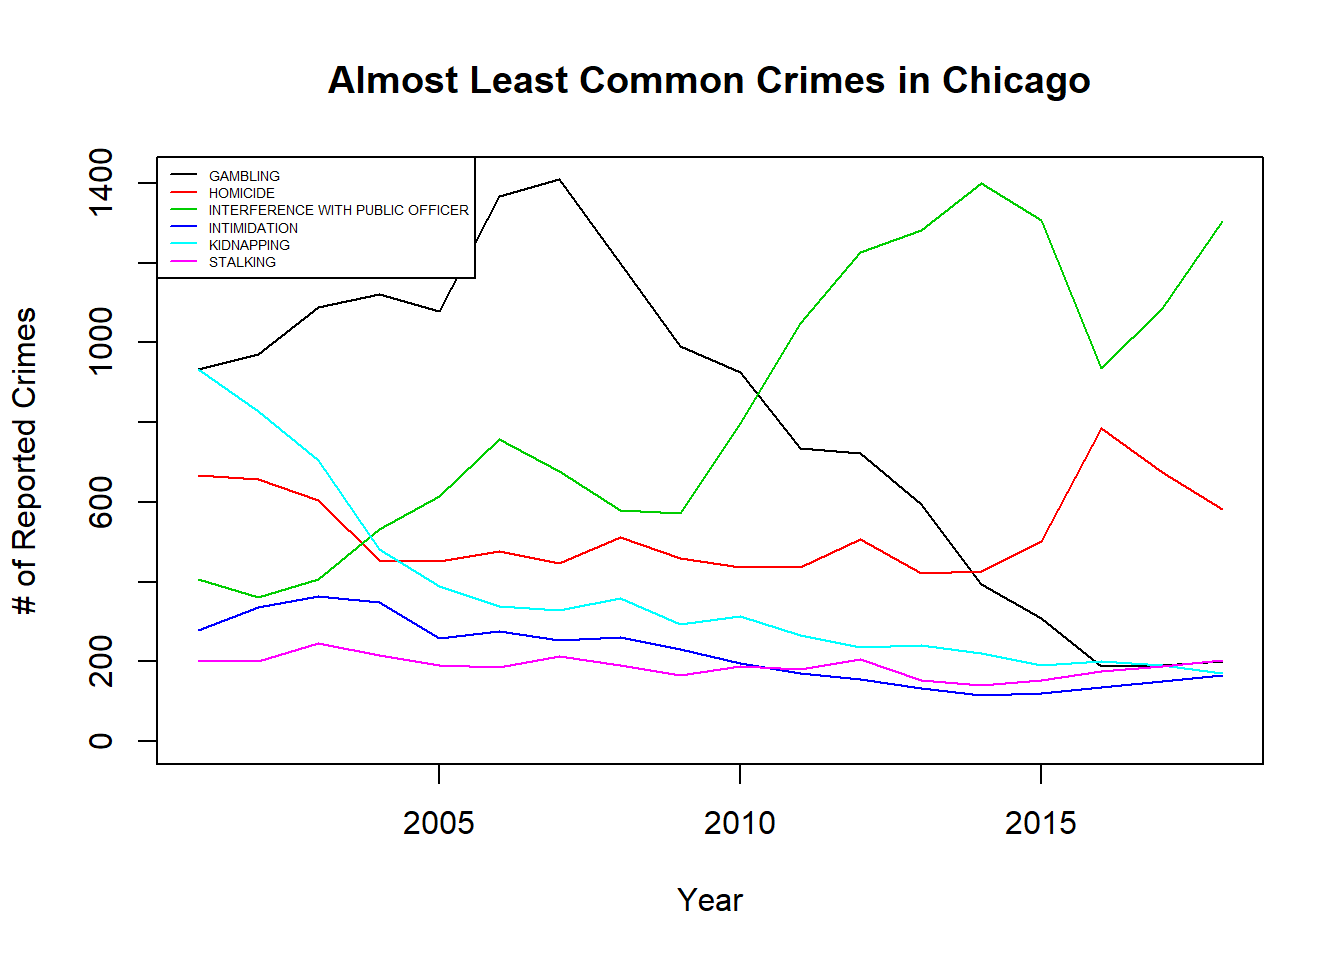
Here we see that headline grabbing homicide number. 786 homicides in 2016 were the highest since at least 2002. But that too reduced to 674 in 2017 (similar to 2001’s 667) and to 583 in 2018 (similar to 2003’s 604). Another thing to notice is interference with public officer has been up since 2010. Certainly something to look into.
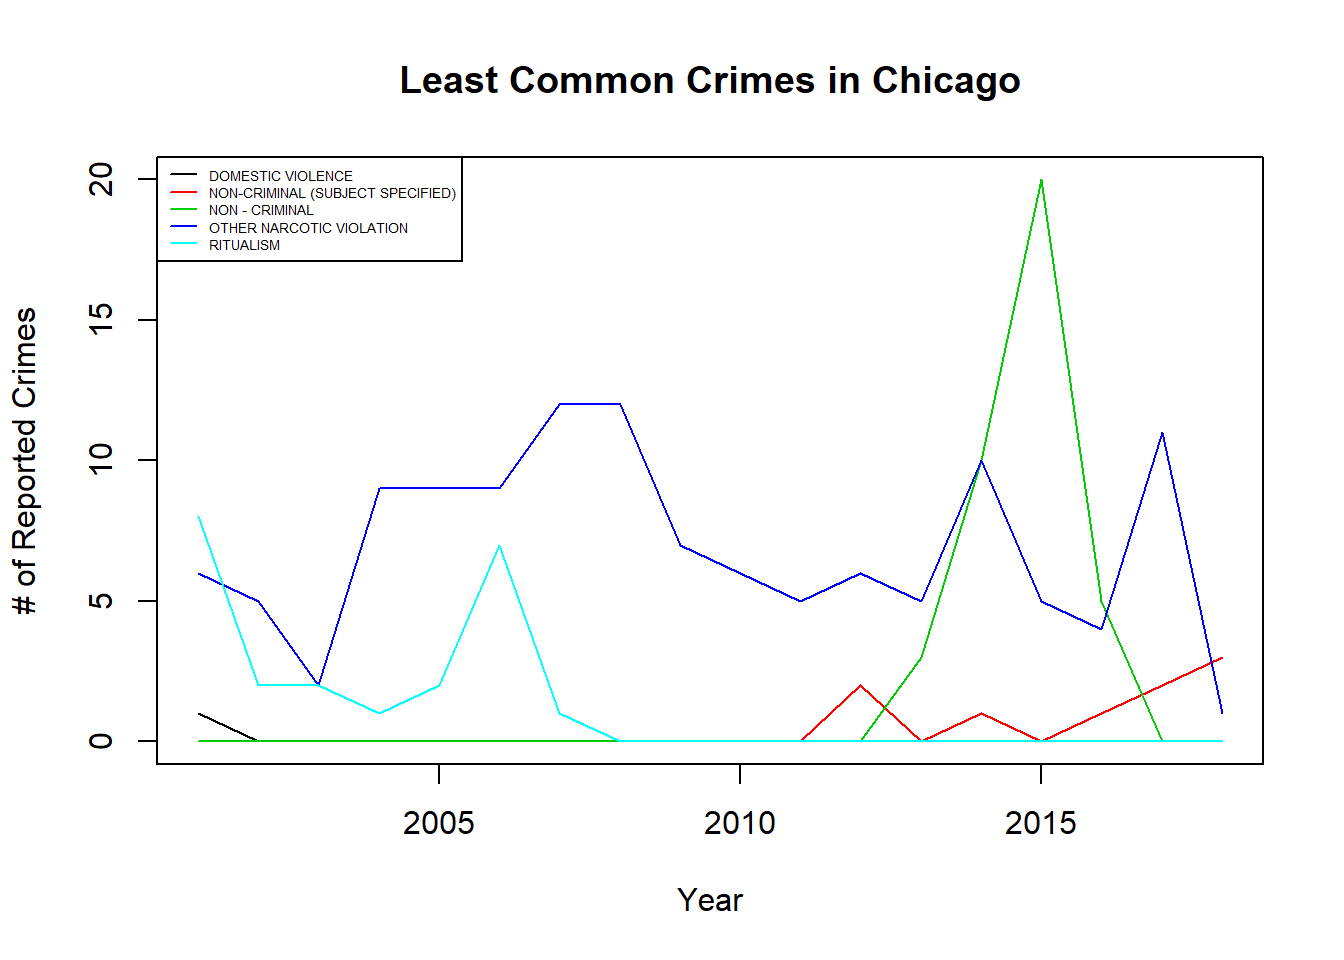
These least common crimes number in the single or double digits for THE ENTIRE CITY! So it’s of no use to look at any trends there. It’s noise. One thing that sticks out to me are the 0 domestic violence numbers for every year but 2001. Really?
The takeaway from all of those graphs: Violent crime (assault, battery, homicide, and robbery) has fallen by 44% in Chicago since 2001. From 145,737 incidents to 86,000, with the majority (about 60%) being battery. And that’s using data that’s known to overestimate the incidence of crimes! This is on par with the rest of the nation that’s seen a 49% drop since 1993 according to the FBI stats. This suggests that the more dependable stats from BJS (74% drop) are also comparable. Not exactly the headlines that we’re used to seeing.
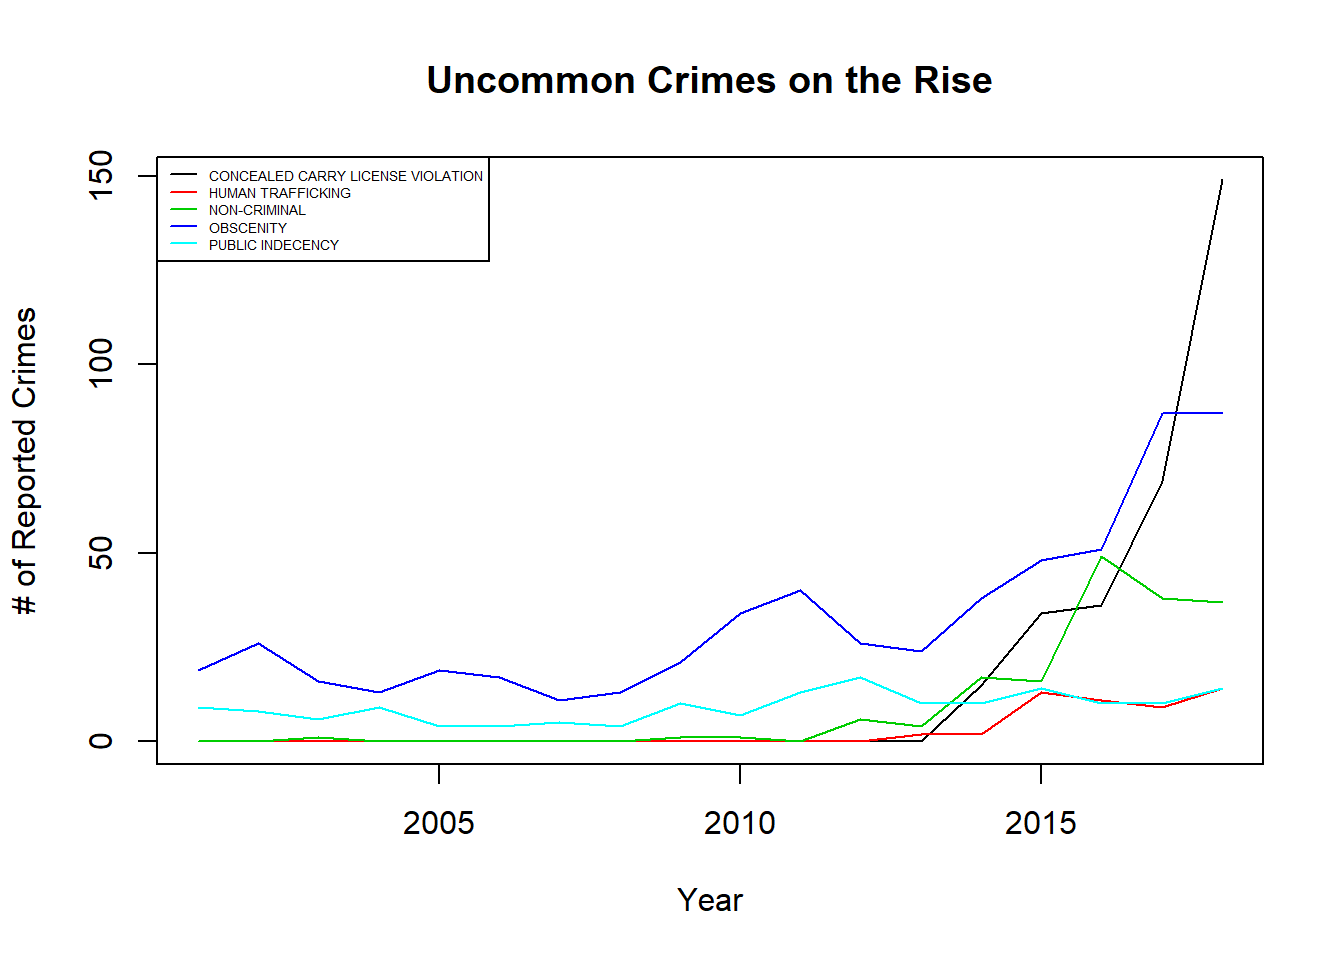
Here are the uncommon crimes that have started trending up. They each probably merit their own discussion.
25th Ward
That was for Chicago at large. Next we’ll look at the stats for the 25th Ward. The boundaries were changed in 2012, so that’s when the graphs start.
Edit: The tags in the data for the wards have a few problems. This made the resulting visualizations and analysis useless. I’m deleting it for now. Worry not. Much of the old and new 25th Ward lies in the following two community areas that were analyzed. Moreover, given the gerrymandered nature of the ward boundaries and the existence of meaningful boundaries like community areas and police districts, I question even putting it back in.
Lower West Side
We have not only have ward level data, but also community level data. The Lower West Side encompasses Pilsen, East Pilsen, the Heart of Chicago, and the Heart of Little Italy neighborhoods. The community level data goes back to 2002, so that’s when the graphs start.
It’s largely the same story as the rest of the city: Everything is down over the last 17 years with a little spike here or there in 2016 and/or 2017.


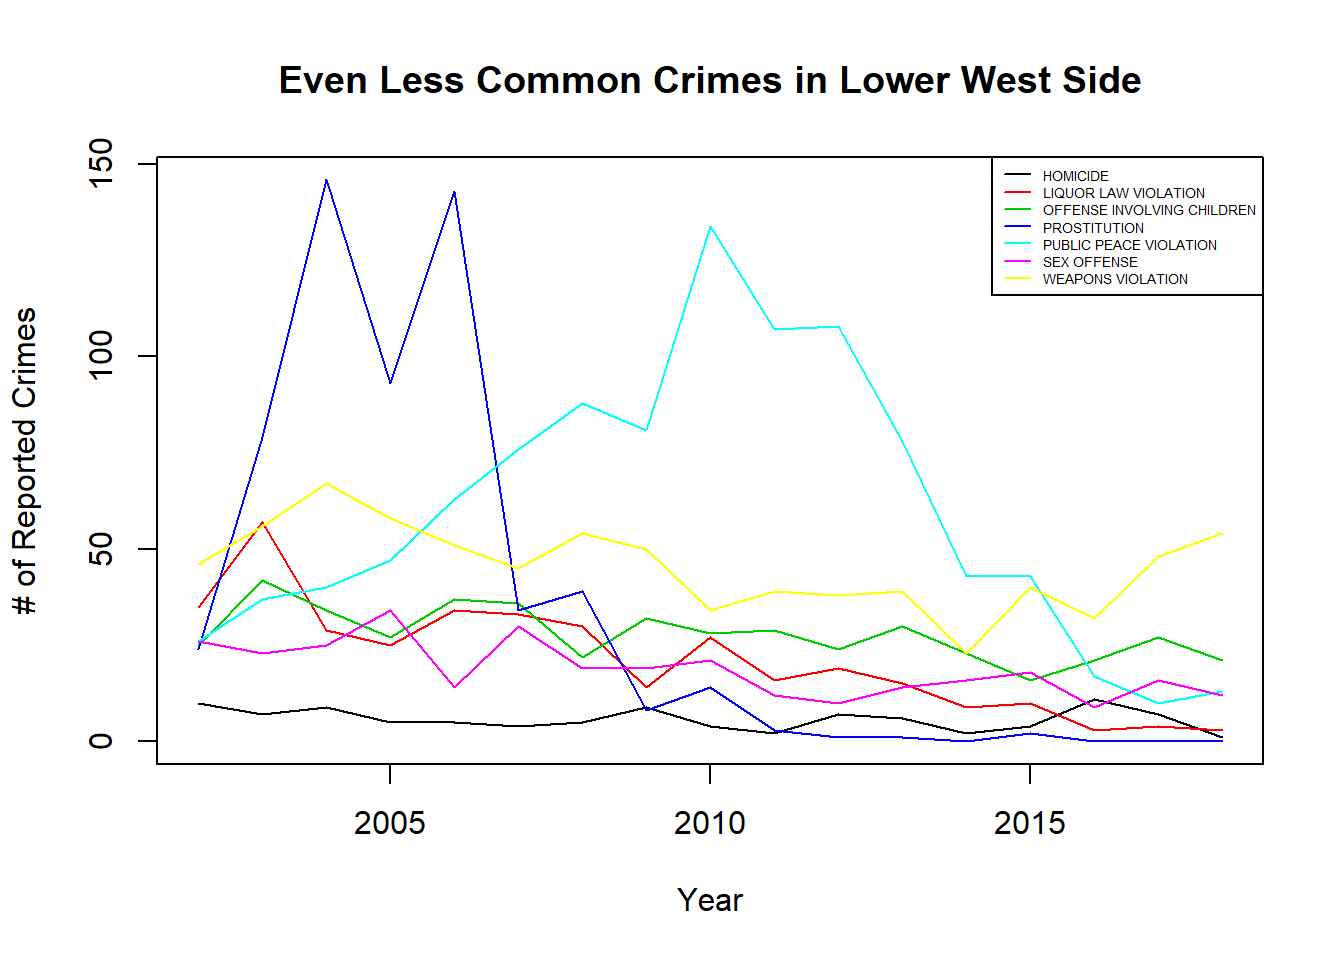

One thing to note here is the disturbing trend for Criminal Sexual Assault. While it’s flat city-wide, that’s not the case here. The news from this week doesn’t help dissuade us from thinking it’s just statistical noise. But we should investigate more before we jump to conclusions.
The remaining crime categories have so few instances it’s not worth making a graph for them.
| CONCEALED CARRY LICENSE VIOLATION | 2 |
| DOMESTIC VIOLENCE | 0 |
| HUMAN TRAFFICKING | 0 |
| NON-CRIMINAL | 1 |
| NON-CRIMINAL (SUBJECT SPECIFIED) | 0 |
| NON - CRIMINAL | 1 |
| OTHER NARCOTIC VIOLATION | 1 |
| PUBLIC INDECENCY | 0 |
| RITUALISM | 0 |
Near West Side
The greater Pilsen area has lost population over the last decades, so let’s compare that to the Near West Side, which includes the booming West Loop and Little Italy to see if there’s any huge differences.

It looks like theft has long been more of a problem in the Near West Side relative to the rest of the city. Here it’s 2x the number of batteries, whereas in the rest of the city the difference is 10 or 20%. I’d like to hear more about that.

No big changes here.

The offenses involving children here are certainly notable. I won’t speculate. Otherwise, it’s downward trends and noise.
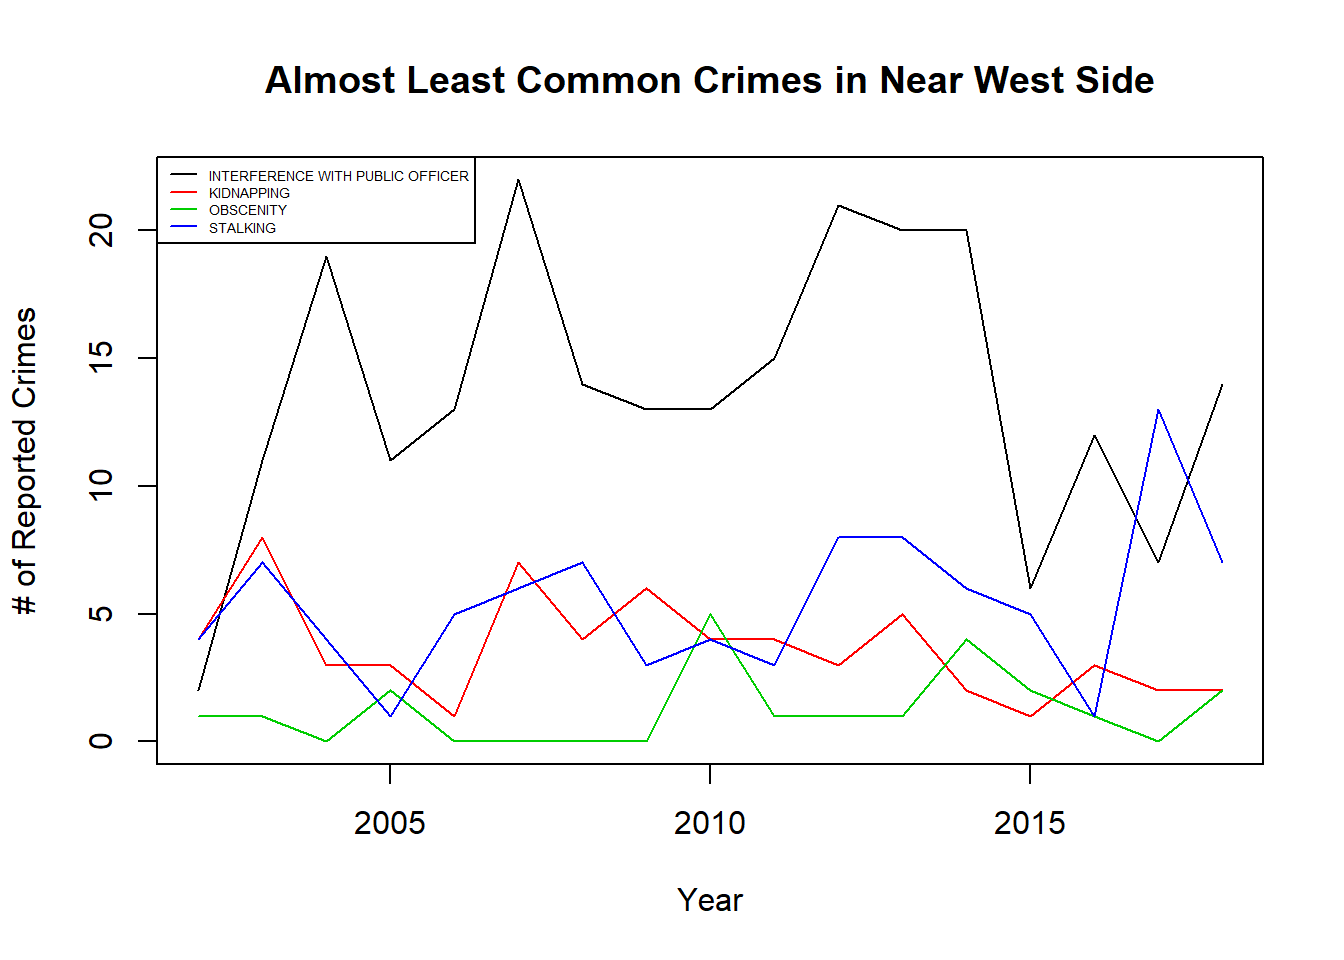
Finally we have the rarest of Near West Side crimes:
| CONCEALED CARRY LICENSE VIOLATION | 8 |
| DOMESTIC VIOLENCE | 0 |
| HUMAN TRAFFICKING | 6 |
| NON-CRIMINAL | 7 |
| NON-CRIMINAL (SUBJECT SPECIFIED) | 0 |
| NON - CRIMINAL | 1 |
| OTHER NARCOTIC VIOLATION | 3 |
| PUBLIC INDECENCY | 4 |
| RITUALISM | 0 |
Other than the spike in crime in 2016/2017 and a few outliers, the Lower West Side is as the Near West Side is as Chicago is as the nation: Crime has largely been trending down over the last two decades.
For the data scientists
You can find the data here. For those interested in doing something similar, I’m in the middle of a campaign, so I’ll put up the code on github soon. If you’re desperate, you can contact me here. Or you can meet me at the Chicago Chapter of the American Statistical Associations annual conference, which just so happens to be on Statistical and Analytic Issues in the Criminal Justice System! I’m sure people much more knowledgeable about these things will have more insight than this first pass through this data.