The Cubs are Value Shoppers
This morning I got a text from a friend and fellow Cubs fan:

My friend is not a statistician. He’s always asking me:
What are the odds of [insert unique sports situation] happening!?
after almost any unique sports situation; expecting me to provide a Little Big League-esque response:
While I will never be a Wally Holland stand-in, I am a statistician who grew up keeping score at countless Wrigley Field games. So I typically issue reminders to my friends like, “Home runs are not the best measure of a baseball players offensive production.”
OPS
For those who don’t know, the go-to statistic for measuring offensive production is OPS (On-base Plus Slugging percentage):
OPS adds on-base percentage and slugging percentage to get one number that unites the two. It’s meant to combine how well a hitter can reach base, with how well he can hit for average and for power.
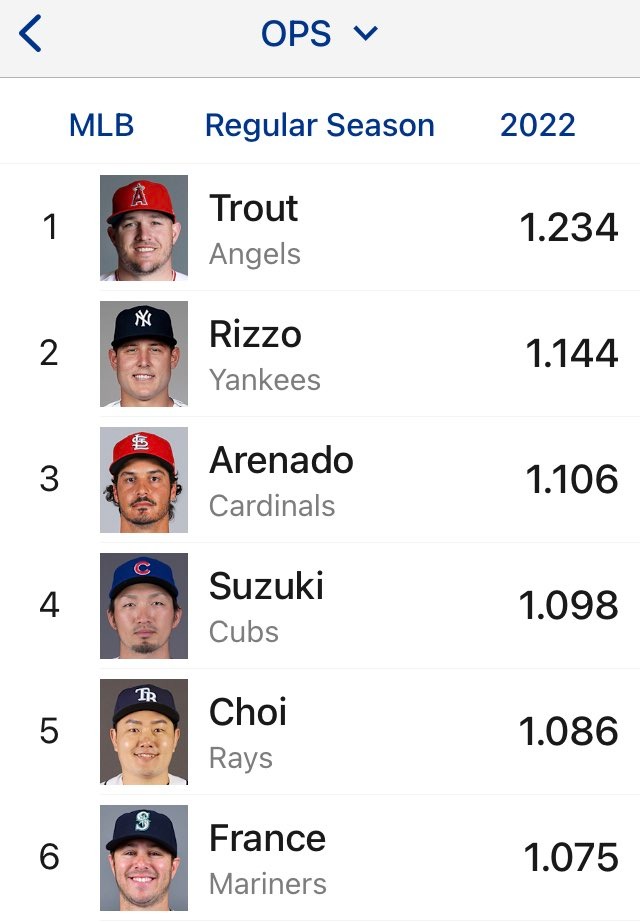
OPS is so much of a standard statistic these days that it’s the default when visiting:
So where does Anthony Rizzo rank on that statistic just 17 games into the season? #2!

As someone who was lucky enough to attend Game 7 of the 2016 World Series, Anthony Rizzo will always have a place in my heart. So I’m happy to see him doing well, even if it is with the Yankees.

But Anthony Rizzo is the Cubs past. Seyia Suzuki, at #4 in the admittedly early and volatile OPS rankings, is the present. This got me wondering how the Cubs are doing in the early days of their controversial rebuild.
A quick scroll through the top 100 OPS ranked players gives us this (as of 4/27/22 at 1:20pm CST) for the Cubs:
- (name - OPS @ OPS rank)
- Suzuki - 1.098 @ #4
- Happ - .943 @ #21
- Conteras - .804 @ #56
- Hoerner - .802 @ #57
- Wisdom - .761 @ #70
For the big-name Cubbies of yesteryear:
- Rizzo - 1.144 @ #2
- Baez* - .973 @ #14
- Castellanos - .895 @ #32
- Bryant - .689 @ #95
- Schwarber - .680 @ #101
*Baez doesn’t have enough plate appearances to be listed due to a jammed thumb
Salary
The Cubbies offensive production is competitive, if not better, with the current team than the big-name guys of yesteryear. This got me thinking about the lack of investment that many fans are annoyed by. A quick trip to spotrac provided those numbers:
- (name - annual salary in millions of dollars)
- Suzuki - 8
- Happ - 6.85
- Conteras* - 9.6
- Hoerner - 0.72
- Wisdom - 0.73
Compare this to the eye-popping numbers for the old core:
- Rizzo - 16
- Baez - 20
- Castellanos - 20
- Bryant - 18
- Schwarber - 19
*Contreras doesn’t have a signed contract and is going to arbitration :(
Value
We can visualize this by plotting Salary against OPS. The top left is the best place to be from a team perspective; i.e. low-cost/high production player makes for more room in the salary cap allowing for mid-season moves. The top right is the best place to be from a player’s perspective; i.e. they’re getting paid well and doing the job well. The bottom right is worst; i.e. they’re getting paid well, but not performing so well.

We can see that the top 5 new Cubs are all making less than the top 5 old Cubs. However, the OPS’s are at par. On offense, Suzuki is the new Rizzo, Happ is the new Baez, Contreras is the new Castellanos, etc.
We can summarize these numbers by creating a Value statistic where we divide OPS by Salary; i.e. OPS per million dollars:
##     Hoerner      Wisdom      Suzuki        Happ   Contreras       Rizzo
##        1.11        1.04        0.14        0.14        0.08        0.07
##        Baez      Bryant   Schwarber Castellanos
##        0.05        0.04        0.04        0.04
The graph and the corresponding statistic make it clear that Hoerner and Wisdom are providing a lot of bang for their buck (keep it up!) while Bryant and Schwarber are off to a mediocre start given their salaries. Moreover, all 5 of the current Cubs are (as of now) providing better value than the old Cubs. In the case of Hoerner and Wisdom, they’re straight-up outperforming Bryant and Schwarber for 1/25 of the salary.
WAR
We can do the same with the more complicated but more thorough WAR statistic. From USA Today:
Wouldn’t it be great to have a single number that could sum up everything a player does to help a team win? That’s WAR. It combines hitting, pitching, defense and baserunning and compares a player’s output to what a typical replacement player called up from the minors would be expected to produce.
I’ll let you dig into the WAR formula that I used from FanGraphs, but the situation isn’t terribly different.
 Calculating the corresponding
 Value statistic based off of WAR results in largely the same situation, except that Rizzo edges out Contreras in this scenario.
##     Hoerner      Wisdom        Happ      Suzuki       Rizzo   Contreras
##        1.11        0.27        0.12        0.11        0.07        0.05
## Castellanos   Schwarber        Baez      Bryant
##        0.02        0.01        0.01       -0.01
Takeaway
It’s an early season and sample size isn’t large, but for all the hemming and hawing about the Cubs trading away their core players last year, the team is in a much better position going forward, for this year and next.